Analys is of spatial clustering of coronavirus disease in Shandong Province during January and February of 2020
-
+ English摘要:目的
描述山东省新型冠状病毒肺炎(coronavirus disease 2019,COVID-19)的空间热点,探讨其报告病例的聚集性,为制定区域化COVID-19疫情防控策略提供依据。
方法采用地理信息系统对山东省各地级市卫生健康委员会COVID-19公告病例数进行管理,采用全局经验贝叶斯平滑、空间经验贝叶斯平滑、全局自相关和局部自相关分析以及空间扫描统计分析方法对数据进行分析。
结果山东省2020年1月21日—2020年2月20日共报告COVID-19病例548人,77.19%的病例集中在15~59岁,男性病例占56.02%;报告病例数呈现空间差异性,其中青岛、威海、济南等市的县区报告发病例数较多,超额危险(ER) > 1的县区有45个;全局空间自相关分析未发现COVID-19存在自相关(Moran's I=-0.027,P > 0.05),局部空间自相关分析发现1个热点区域(HH地区),7个冷点区域(LL地区),4个空间异常点(HL或LH地区);空间扫描分析得到9个有统计学意义的可能聚集区,其中前3个聚集区分别出现在济南市中区(RR=8.65,P < 0.01)、潍坊奎文区(RR=9.02,P < 0.01)和泰安泰山区(RR=6.41,P < 0.01)。
结论山东省COVID-19总体分布呈离散性,有1/3县区存在发病超额风险,存在局部聚集性。
-
自2019年12月以来,新型冠状病毒肺炎(coronavirus disease 2019,COVID-19)暴发,后逐渐成为全球性公共卫生突发事件[1-2]。2019年新型冠状病毒肺炎大流行在6个月内导致800多万人感染和超过44万病例死亡[3]。根据《中华人民共和国传染病防治法》,COVID-19被纳入我国法定乙类传染病,采取了甲类传染病防治措施[4]。山东省自2020年1月21日出现首例COVID-19确诊病例,1月24日,山东省启动重大突发公共卫生事件Ⅰ级响应。本研究拟运用空间流行病学方法,描述山东省2020年1月21日—2020年2月20日COVID-19报告病例的空间分布,旨在发现山东省COVID-19的空间热点,探讨COVID-19是否存在聚集性,为制定区域化COVID-19疫情防控策略、卫生资源的优化配置提供理论依据。
1. 资料与方法
1.1 资料来源
山东省位于中国东部沿海,辖16个地级市,共57个市辖区、27个县级市、53个县,合计137个县级行政区,全省陆域面积15.58万km2,常住人口10 070.21万人。
病例数据全部来自于山东省各县区卫生健康委员会官方网站的“新型冠状病毒肺炎疫情情况公告数据”(2020年1月21日—2020年2月20日)。收集的资料包括累计确诊例数、男性累计确诊例数、女性累计确诊例数、14岁及以下累计确诊例数、15 ~ 59岁累计确诊例数、60岁及以上累计确诊例数。COVID-19的诊断标准依据国家卫生健康委办公厅颁布的《新型冠状病毒肺炎诊疗方案(试行第三版至第六版)》,其确诊病例需有病原学证据阳性结果,如呼吸道标本或血液标本行实时荧光RT-PCR检测新型冠状病毒核酸阳性;或病毒基因测序,与已知的新型冠状病毒高度同源。利用Excel对数据进行整理,空间最小尺度为县区。
1.2 方法
本研究采用空间流行病学方法对山东省COVID-19报告病例的空间分布特征进行分析,探讨COVID-19发病的热点区域,明确COVID-19是否存在高发区域,并揭示其空间聚集性。
首先利用描述性分析对COVID-19报告病例的人口信息进行统计。利用ArcGIS 10.4软件对山东省各县区的COVID-19报告病例进行管理,构建ESRI Shapefile空间数据库。利用GeoDa 1.10软件,运用四分位数间距法对COVID-19报告病例数进行分级,得到COVID-19在各县区的专题疾病分布图。由于每个地区人口基数不同,在考虑到人口基数以及邻近区域的范围、邻近区域的人口数、平均发病率以及发病率均数和方差等方面的问题后,采用全局经验贝叶斯平滑和空间经验贝叶斯平滑方法对COVID-19报告发病率进行优化以调整空间数据的变异性,并绘制COVID-19的超额风险(excess risk,ER)图。
其次进行空间自相关分析。空间自相关分析可以利用临近位置的属性或现象相关性来寻找存在的空间聚集性或“热点”[5]。本研究采用GeoDa 1.10软件进行空间自相关分析,其步骤主要有三步:(1)建立空间权重矩阵,本研究采用二进制邻接权重矩阵;(2)进行全局空间自相关分析,判断COVID-19的发病情况在整个研究区域内是否存在相关关系,本研究采用全局Moran's I统计量衡量全局空间自相关性,I的大小反映空间自相关关系的强弱,I越接近于-1,其分布越离散,越接近1,其分布越聚集;(3)进行局部空间自相关分析,找出COVID-19是否存在局部的空间聚集[6],并依据Moran's I LISA指标将研究区域划分为:热点区域(HH区域,即高-高聚集区)、空间异常点(HL区域和LH区域)和冷点区域(LL区域)。
最后利用SaTScan 9.6软件进行空间扫描统计。空间扫描的目的在于探测空间范围内疾病发生数的异常增加,并检验这种增加是否由于随机变异所造成,进而探测研究区域内是否存在聚集性、聚集性的位置和聚集区域的风险大小。本研究根据Poisson分布计算出研究中的每个扫描窗口的预期COVID-19发病数,再联合扫描窗口内外的COVID-19实际发病数,利用似然比计算公式计算对数似然比(log likelihood ratio,LLR),用LLR来评价扫描窗口内发病数的异常程度,并将LLR按降序排列,最大为一级聚集区,给出相对危险度(relative risk,RR)及利用蒙特卡罗法模拟计算P值,其RR值为扫描窗口内的发病率与扫描窗口外的发病率之比。另外,还对其他LLR较大窗口进行统计学评价,产生次要聚集区域。本研究所有统计分析结果,均以P < 0.05为有统计学意义。
2. 结果
2.1 COVID-19一般情况
2020年1月21日,山东省出现首例输入性COVID-19确诊病例。截至2020年2月20日24时,山东省累计报告COVID-19确诊病例748例,本研究未纳入某监狱病例。
在548例COVID-19病例中,女性241例(占43.98%),男性307例(占56.02%)。COVID-19报告发病率为0.54/10万,女性为0.50/10万,男性为0.61/10万。报告病例中最小年龄为2月龄,最大为86岁;14岁以下报告病例为31人,15 ~ 59岁的424例,分别占总报告病例数的5.66%和77.37%,60岁以上报告病例占总报告病例数的16.97%。
2.2 COVID-19空间分布描述
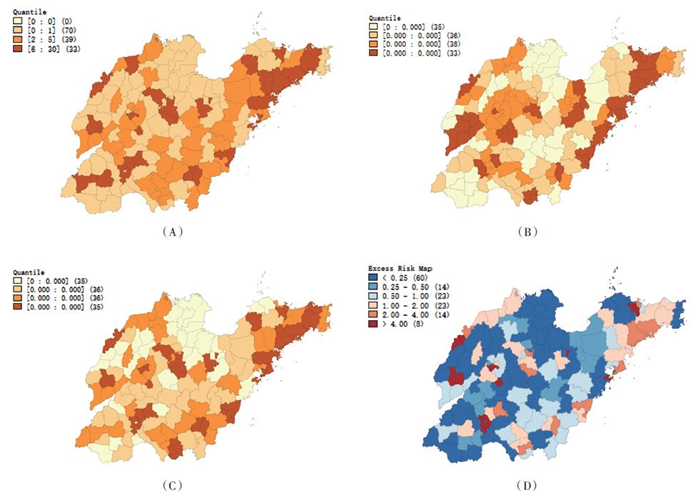
COVID-19在山东省分布较为分散,其空间差异性明显,青岛、威海、济南等市的县区报告发病例数较多,报告病例数最高的前3个县区分别为济南市市中区(30例)、济宁市任城区(29例)和聊城市东昌府区(27例)[图 1(A)]。经全局经验贝叶斯平滑和空间经验贝叶斯平滑后的发病率分布与发病专题地区分布情况基本一致[图 1(B)、1(C)]。有8个县区ER > 4,其中聊城市东昌府区、泰安市泰山区、潍坊市奎文区等县区的超额发病较高,1 < ER < 4的有37个县区,ER > 1的县区共有45个[图 1(D)]。
2.3 COVID-19空间自相关
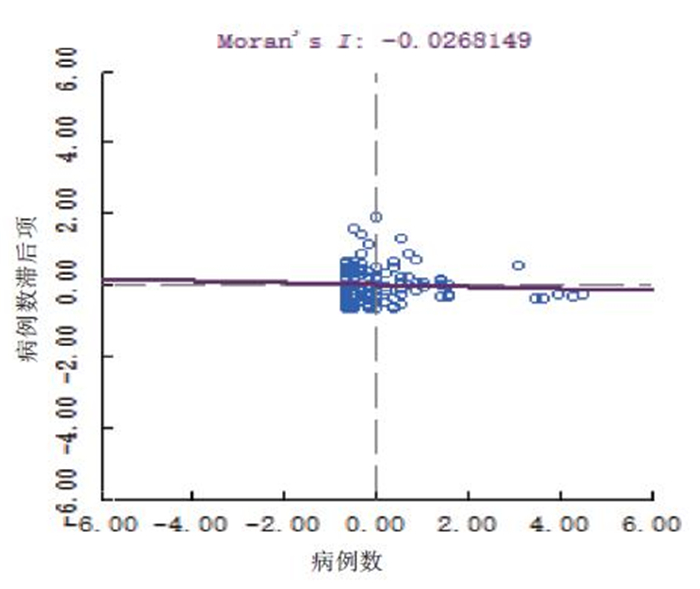
全局自相关Moran's I系数如图 2所示,其Moran's I = -0.027,但经统计学检验,Z = -0.425(P = 0.350),表明从总体上COVID-19不存在空间自相关性。
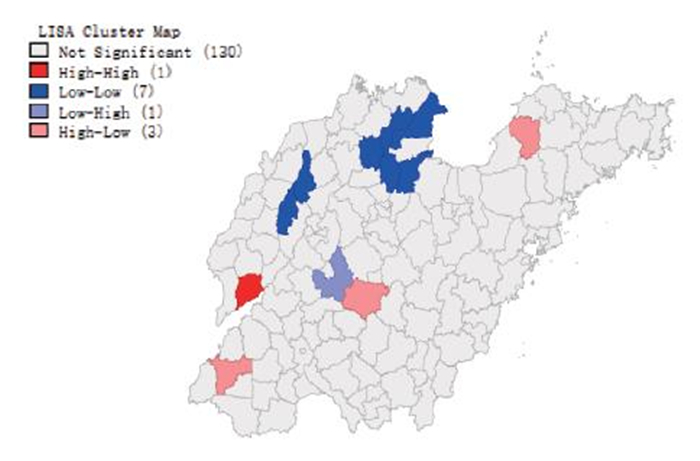
COVID-19的局部空间自相关分析结果显示,热点区域(HH区域)有1个,为聊城市阳谷县;冷点区域(LL区域)有7个,分布在德州市临邑县和齐河县,东营市垦利县、利津县和广饶县,滨州市博兴县和滨城区;空间异常区域(LH和HL)有4个,分别为泰安市岱岳区和新泰市,菏泽市牡丹区,烟台市招远市。见图 3。
2.4 空间扫描分析
山东省COVID-19空间扫描分析结果如表 1所示。新冠肺炎扫描发现13个聚集地区,其中有9个差异具有统计学意义(P < 0.05):第一聚集区在济南市市中区(RR = 8.65,P < 0.01),前两个次要聚集区分别出现在潍坊市奎文区(RR = 9.02,P < 0.01)和泰安市泰山区(RR = 6.41,P < 0.01)。另外,济宁市中区、任城区,聊城市东昌府区,青岛市市南区、市北区、四方区、黄岛区、崂山区、李沧区等县区也是次要聚集区。
表 1 山东省COVID-19空间聚集性分析聚集区域 聚集县区 实际发病数 预期发病数 LLR值 RR值 P值 1类 济南市中区 30 3.65 37.521 8.65 < 0.01 2类 潍坊奎文区 25 2.89 32.289 9.02 < 0.01 3类 泰安泰山区 24 3.89 23.934 6.41 < 0.01 4类 济宁市中区、任城区 29 6.46 21.493 4.69 < 0.01 5类 聊城东昌府区 27 6.12 19.610 4.59 < 0.01 6类 青岛市南区、市北区、四方区、黄岛区、崂山区、李沧区 42 15.28 16.429 2.89 < 0.01 7类 德州武城县 13 2.13 12.758 6.23 < 0.01 8类 烟台芝罘区、福山区、牟平区、莱山区、开发区、海阳市,威海文登区、乳山市 48 22.30 11.733 2.26 < 0.01 9类 临沂兰山区、河东区 24 9.71 7.614 2.54 < 0.05 10类 济宁曲阜市 13 3.70 7.126 3.58 > 0.05 11类 淄博淄川区、博山区 18 6.94 6.212 2.65 > 0.05 12类 日照东港区 12 5.09 3.430 2.39 > 0.05 13类 淄博张店区 9 3.93 2.417 2.31 > 0.05 3. 讨论
本研究发现2020年1月21日—2月20日山东省新型冠状病毒肺炎报告病例以男性多见、成年人为主。新型冠状病毒肺炎的报告发病呈现空间差异性,其青岛市、威海市、济南市等县区报告发病数较多。研究期间存在较多的超额危险区域。通过空间自相关分析发现山东省有1个高-高聚集区,空间聚集性分析进一步发现9个可能聚集区,其中前三个聚集区分别出现在济南市市中区、潍坊市奎文区和泰安市泰山区。
本研究发现山东省COVID-19报告病例中男性患者比例较高(56.02%),与其他一些研究结果类似(男性患者所占比重较大)[7-8],其原因可能是,COVID-19的流行伴随着中国春节的人口流动,春运期间大批在外务工男性返乡。研究发现,COVID-19报告病例呈现空间差异性,报告病例数最高的县区为济南市市中区(30例,占5.48%),其可能原因为:济南市作为山东省省会城市,市中区是济南四大市中心之一,社会经济资源分布较为密集、人口密度大、流动人口多,为新型冠状病毒的传播提供了条件[9]。有研究也报道了COVID-19的流行与自然、社会、经济有显著的关系,大多是在规模较大的城市[10]。
COVID-19作为一类紧急且传播迅速的疾病,进行空间流行病学分析,可以确定高风险区域,有利于优先分配卫生资源,并实施有助于监测和控制病例的干预措施[11]。COVID-19的局部空间自相关分析结果显示,聊城市阳谷县是山东省热点区域,而聊城市东昌府区报告病例数居多,其原因可能是,阳谷县的LISA统计量受到空间相临近的东昌府区观察值影响,造成其空间关联模式形成了高-高聚集区,有研究表明,因为临近区域的人们互相交流频繁,新型冠状病毒极有可能在地理邻域间传播[12]。有研究显示聊城市的发病以聚集性疫情为主,新型冠状病毒传播以人聚集的地方为主,其结果与我们分析出聊城为COVID-19的热点区域有相似性[13]。山东省COVID-19空间扫描分析结果显示,第一聚集区在济南市中区,前两个次要聚集区分别出现在潍坊奎文区和泰安泰山区。空间扫描统计量法则是以似然比为基础,通过建立圆形动态窗口来探测聚集区域,局部空间自相关分析是通过计算每个空间位置的相关指标并通过假设检验来判断聚集性,这就是造成空间扫描统计分析结果与局部自相关分析结果不完全相同的原因。有报道[14]显示山东中东部地区是COVID-19的高危风险区,其空间扫描结果与本研究不完全相同,其主要原因可能是在使用空间扫描窗口时所采用尺度不同而致。密切监测对于控制COVID-19大规模传播至关重要。因此,为了预防聚集性病例的出现,应加强公共卫生监测、卫生知识宣传、公共场所和重点人群监测;做好综合医疗机构和部分专科医院收治COVID-19患者的准备,确保重症和危重病例能够及时鉴别、诊断和有效治疗[15]。
利用空间流行病学技术,能够确定山东省新型冠状病毒肺炎的聚集性,有利于新型冠状病毒肺炎疫情的监测预警,也有利于医务卫生人员调查疾病的暴发是否与环境、人群活动等因素有关。本研究对COVID-19发病热点或聚集群的探索,对实时监测和指导公共卫生调查、制定和执行防控策略都具有参考价值。但本研究也存在一定的局限性:第一,研究尺度的局限性,本研究以县区为基本单元,无法推测城乡的分布规律和具体聚集性疫情;第二,未进行COVID-19流行的影响因素分析。
作者声明 本文无实际或潜在的利益冲突 -
表 1 山东省COVID-19空间聚集性分析
聚集区域 聚集县区 实际发病数 预期发病数 LLR值 RR值 P值 1类 济南市中区 30 3.65 37.521 8.65 < 0.01 2类 潍坊奎文区 25 2.89 32.289 9.02 < 0.01 3类 泰安泰山区 24 3.89 23.934 6.41 < 0.01 4类 济宁市中区、任城区 29 6.46 21.493 4.69 < 0.01 5类 聊城东昌府区 27 6.12 19.610 4.59 < 0.01 6类 青岛市南区、市北区、四方区、黄岛区、崂山区、李沧区 42 15.28 16.429 2.89 < 0.01 7类 德州武城县 13 2.13 12.758 6.23 < 0.01 8类 烟台芝罘区、福山区、牟平区、莱山区、开发区、海阳市,威海文登区、乳山市 48 22.30 11.733 2.26 < 0.01 9类 临沂兰山区、河东区 24 9.71 7.614 2.54 < 0.05 10类 济宁曲阜市 13 3.70 7.126 3.58 > 0.05 11类 淄博淄川区、博山区 18 6.94 6.212 2.65 > 0.05 12类 日照东港区 12 5.09 3.430 2.39 > 0.05 13类 淄博张店区 9 3.93 2.417 2.31 > 0.05 -
[1] LV M, LUO X, ESTILL J, et al. Coronavirus disease (COVID-19):ascoping review[J]. Euro Surveill, 2020, 25(15):2000125.
[2] BURKI T. Outbreak of coronavirus disease 2019[J]. Lancet Infect Dis, 2020, 20(3):292-293. doi: 10.1016/S1473-3099(20)30076-1
[3] World Health Organization. Coronavirus disease 2019(COVID-19) Situation Report-149[DB/OL]. (2020-06-17)[2020-06-18]. https://www.who.int/docs/default-source/coronaviruse/situation-reports/20200617-covid-19-sitrep-149.pdf?sfvrsn=3b3137b0_4.
[4] YANG L L, YANG T. Pulmonary Rehabilitation for Patients with Coronavirus Disease 2019(COVID-19)[J]. Chronic Dis Transl Med, 2020, 6(2):79-86. http://d.wanfangdata.com.cn/periodical/mxjbyzhyx-e202002005
[5] MOSHA J F, STURROCK H J, GREENWOOD B, et al. Hot spot or not:a comparison of spatial statistical methods to predict prospective malaria infections[J]. Malar J, 2014, 13:53. doi: 10.1186/1475-2875-13-53
[6] GUI J, LIU Z, ZHANG T, et al. Epidemiological characteristics and spatial-temporal clusters of hand, foot, and mouth disease in Zhejiang Province, China, 2008-2012[J]. PLoS One, 2015, 10(9):e0139109. doi: 10.1371/journal.pone.0139109
[7] GULIYEV H. Determining the spatial effects of COVID-19 using the spatial panel data model[J]. Spat Stat, 2020, 38:100443. doi: 10.1016/j.spasta.2020.100443
[8] LI Q, GUAN X, WU P, et al. Early transmission dynamics in Wuhan, China, of novel coronavirus-infected pneumonia[J]. N Engl J Med, 2020, 382(13):1199-1207. doi: 10.1056/NEJMoa2001316
[9] REN H, ZHAO L, ZHANG A, et al. Early forecasting of the potential risk zones of COVID-19 in China's megacities[J]. Sci Total Environ, 2020, 729:138995. doi: 10.1016/j.scitotenv.2020.138995
[10] XIONG Y, WANG Y, CHEN F, et al. Spatial Statistics and Influencing Factors of the COVID-19 Epidemic at Both Prefecture and County Levels in Hubei Province, China[J]. Int J Environ Res Public Health, 2020, 17(11):3903. doi: 10.3390/ijerph17113903
[11] DESJARDINS MR, HOHL A, DELMELLE EM. Rapid surveillance of COVID-19 in the United States using a prospective space-time scan statistic:detecting and evaluating emerging clusters[J]. Appl Geogr, 2020, 118:102202. doi: 10.1016/j.apgeog.2020.102202
[12] KANG D, CHOI H, KIM J H, et al. Spatial epidemic dynamics of the COVID-19 outbreak in China[J]. Int J Infect Dis, 2020, 94:96-102. doi: 10.1016/j.ijid.2020.03.076
[13] WANG L, DUAN Y, ZHANG W, et al. Epidemiologic and clinical characteristics of 26 cases of COVID-19 arising from patient-to-patient transmission in Liaocheng, China[J]. Clin Epidemiol, 2020, 12:387-391. doi: 10.2147/CLEP.S249903
[14] QI C, ZHU Y C, LI C Y, et al. Epidemiological characteristics and spatial-temporal analysis of COVID-19 in Shandong Province, China[J]. Epidemiol Infect, 2020, 148:e141. doi: 10.1017/S095026882000151X
[15] DENG S Q, PENG H J. Characteristics of and Public Health Responses to the Coronavirus Disease 2019 Outbreak in China[J]. J Clin Med, 2020, 9(2):575. doi: 10.3390/jcm9020575
-
期刊类型引用(2)
1. 周洋,陶明勇,卢肇骏,严睿,邓璇,唐学雯,朱瑶,何寒青,姚亚萍. 浙江省2010—2019年甲型肝炎流行特征和时空聚集性分析. 中华预防医学杂志. 2022(04): 459-463 .  百度学术
百度学术
2. 陈喆,葛军,温琪,邱婷婷,曾小军. 江西省2016-2019年土源性线虫病时空聚集性分析. 中国热带医学. 2022(09): 825-831 .  百度学术
百度学术
其他类型引用(1)


 下载:
下载:


